
Twitter is a social media platform that’s fast, fun, and most importantly for ecommerce businesses, free. It can help you drive traffic to your online store, build a loyal customer base, and increase sales revenue, all without any upfront costs. But as you begin using Twitter, you’ll find that more and more online store owners are battling for attention through 280 characters or less. That’s why you’ll need to sharpen your wit and stand out, and Twitter analytics can help.
Twitter analytics offers a wealth of information that can help you create meaningful content that resonates with your target customers. After all, Twitter users interact with brands in important ways. If you’re not analyzing the performance of your own tweets, you can miss out on key Twitter metrics that could help you hone your Twitter marketing strategy and maximize ROI.
In this post, we look at what Twitter analytics is, why it is a great tool, and how you can use it to define the success of your Twitter campaigns. In addition, we’ve compiled a list of Twitter analytics tools that you can use to understand your audience, perform Twitter competitor analysis, and grow your followers.
Let’s jump in, shall we?
Post Contents


What Is Twitter Analytics?
Twitter analytics provides details on your tweets’ engagement, clicks, retweets, favorites, replies, and more. This data is not only related to your activities on Twitter, but also to the activities of all those who follow you, interact with your tweets, or engage with your content. Twitter analyzes these activities to create a rich set of tweet analytics that show how a user’s Twitter account is performing. Your Twitter analytics dashboard is where you’ll find all of this data.
How Do I Get Analytics on Twitter?
You can access Twitter analytics by logging into your Twitter account and clicking your profile image in the upper-right corner of the screen. This action will display a drop-down menu from where you can select “Analytics” to go to the analytics homepage.

→ Click Here to Launch Your Online Business with Shopify
Alternatively, you can access the Twitter analytics dashboard by visiting this URL: analytics.twitter.com. Once you’re inside the dashboard, Twitter will begin to pull impression and twitter engagement stats for your tweets.
You’ll also see tabs for Tweets, Audiences, Events, Videos, and Conversion Tracking. Each of them offers its own set of insights. Clicking on the Tweets activity dashboard, for instance, allows you to access real-time Twitter user analytics for individual tweets. You can see how people are engaging with your content, get detailed information about who your audience is, as well as view the number of replies, tweets, and follows.
Is Twitter Analytics Free?
Yes, it is. Every Twitter user can access their Twitter analytics free through the process described above. In addition to the native dashboard inside your Twitter account, there are many free and paid Twitter analytics app options that you can use to dig deeper into your data. We’ll discuss those later.
What Do Twitter Analytics Show?
Twitter offers a wide range of metrics that you can use to perform Twitter data analysis. Below is a breakdown of the most crucial ones.
Twitter Impressions
A Twitter impression is the number of times a tweet was viewed by people inside of Twitter. This number is important as it shows if the number of people who viewed your Tweet is increasing or on the decline. If it is growing, you are doing something right, but if it is shrinking, you should consider changing your strategy.
Engagement Rate
For Twitter users, the engagement rate is the total number of engagements over a period of time divided by the number of impressions achieved over the same period.. If you’ve been wanting to learn how to measure Twitter engagement, this metric is your answer.
28 Day Summary
At a glance, your 28 day summary in Twitter analytics shows how your account compares to the previous period. This allows you to see how your account may have grown or decreased over this period.
Top Mentions
Twitter Top Mentions highlights tweets that include a mention of your personal name or brand. Only tweets that received the most impressions over a particular period are highlighted. Keep an eye on this metric to find out who is engaging in conversation about your brand or account.
Top Tweet
Twitter’s Top Tweet is the tweet that received the highest number of impressions over a given period of time. You can use this insight to inform your 2021 Twitter content strategy so that you can continue growing your impression numbers.
Top Follower
This metric showcases your top follower of the month, with the largest following of their own. While this follower has not necessary retweeted your content yet, they have the biggest potential audience. Simply put, your top followers hold the greatest capability to expand the reach of your tweets via comments, mentions and retweets. Make sure to analyze your Twitter mention stats to see where you’re being mentioned and by whom.
Video Completion Rate
Twitter calculates this metric by dividing the number of completed video views by the number of video starts. In plain language, the video completion rate shows that out of the total number of people who viewed the video, what percentage of viewers watched the whole content. This can be used to analyze how popular the video is and whether it’s worth posting something similar on your Twitter account.
What Are the Benefits of Twitter Analytics?

There are many benefits to using the Twitter analytics app to inform your strategy. Below are some of the immediate benefits you can expect to realize.
- Discover more about your tweets: The integrated analytics dashboard will display the Twitter metrics for each tweet. You get to see the total number of impressions and engagements generated by a tweet, as well as its overall engagement rate. If you see spikes in impressions, you can revisit the tweets you shared on those days to discover the reason behind those patterns.
- Deep dive into your audience demographics: Using Twitter analytics, you can get a clear picture of your followers, learning what languages they know and how they’re divided along age groups, as well as their country of residence, gender, and online purchasing behavior. This information should enable you to craft a Twitter strategy that speaks directly to your ideal customer.
- Find the best times of day to tweet: You already know not to post at 3 a.m. because everyone is sleeping. But what about the best hour of the workday, or on weekends? When you perform Twitter data analysis, you’ll see patterns of engagement that you can leverage to reach a greater number of people over time. .
- Validate your Twitter Ad spend: When you’re using promoted tweets to attract eyeballs, you want to know if you’re making good use of your investment. Fortunately, Twitter analytics for business insights lets you compare promoted and organic impressions so that you can gain an understanding of how well your promoted tweets are performing.
How to Use Twitter Analytics
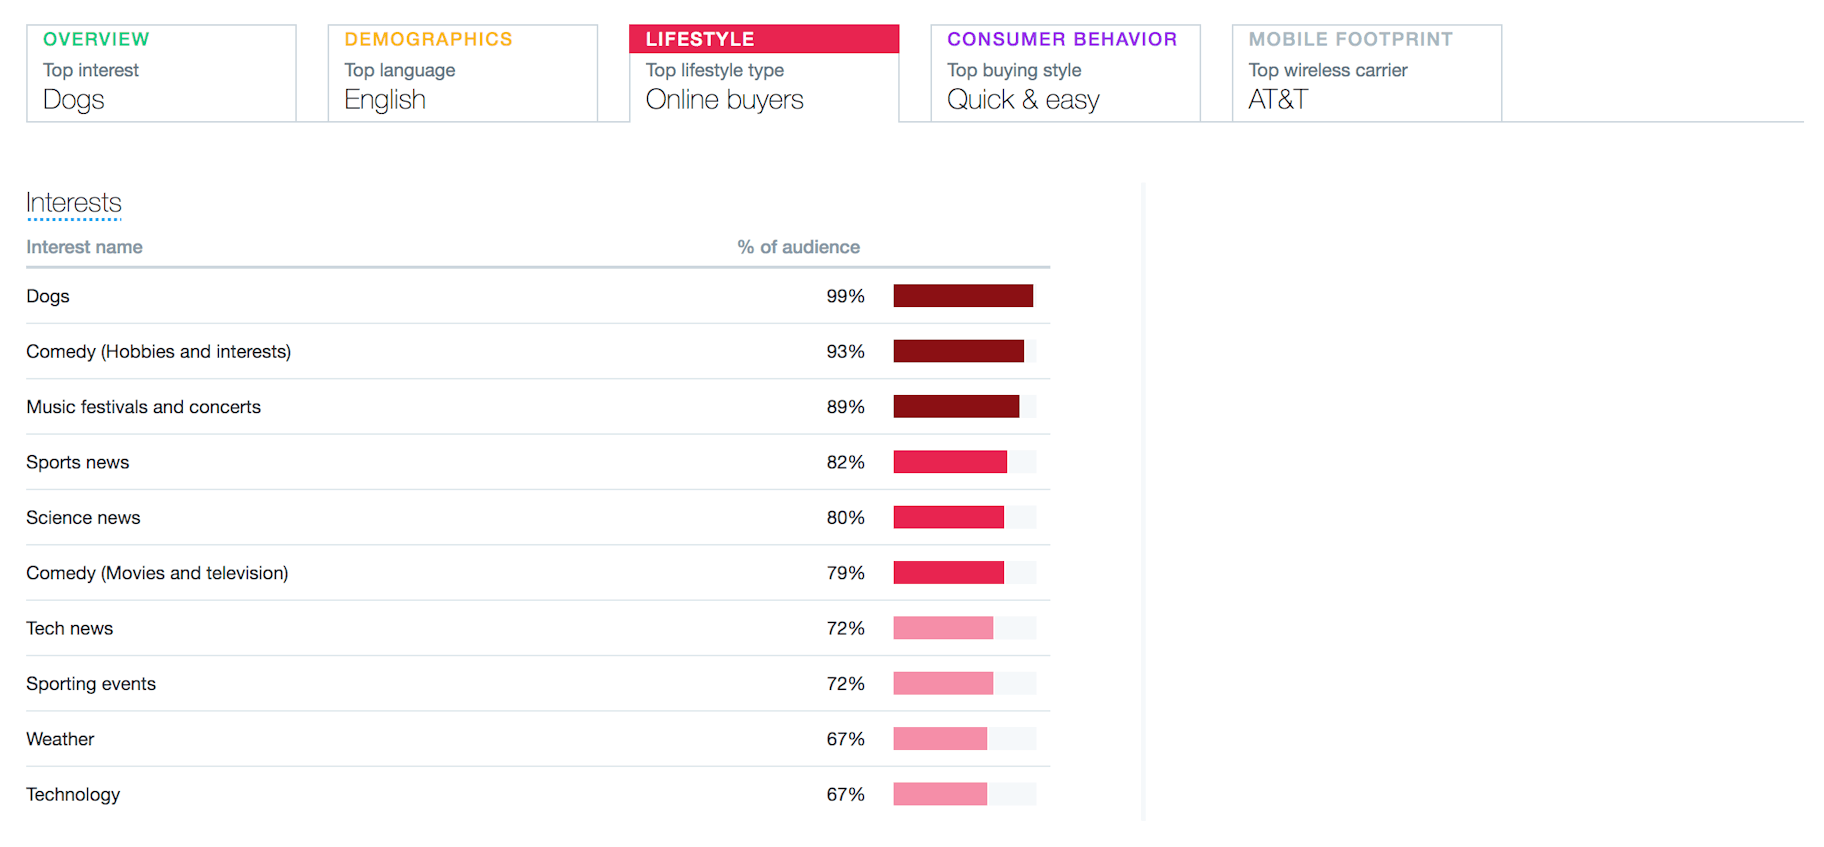
So, how can you get the most out of your Twitter analytics data? Well, there are several ways. First and foremost, you can leverage the data to identify which types of content works best for your account and your goals. The “Interests” bar graph under the “Overview and Lifestyle tabs” in the Audience Overview section will help you see popular topics and what percentage of your followers is interested in them. You can then create and curate content around those topics to grab your audience’s attention.

Another thing you can do is analyze your tweet analytics to see what tweets get people retweeting, liking, and clicking through to read what you have to sell (or say). Find out which kind of tweets get the most engagement, and look for common patterns to replicate. For the purpose, ask yourself the following questions about popular tweets:
- What type of language do the tweets use?
- Do most of them contain images or videos?
- What type of hashtags accompanies the tweets’ content?
The aim of this small exercise is to discover the best characteristics of your top-performing tweets. Create and post tweets that use some of your top tweets’ qualities to encourage audience interaction consistently.
Beyond that, you can use the Events data to create content around upcoming events, holidays, or conferences. Click the Events tab in your Twitter analytics dashboard to see a developing list of events.
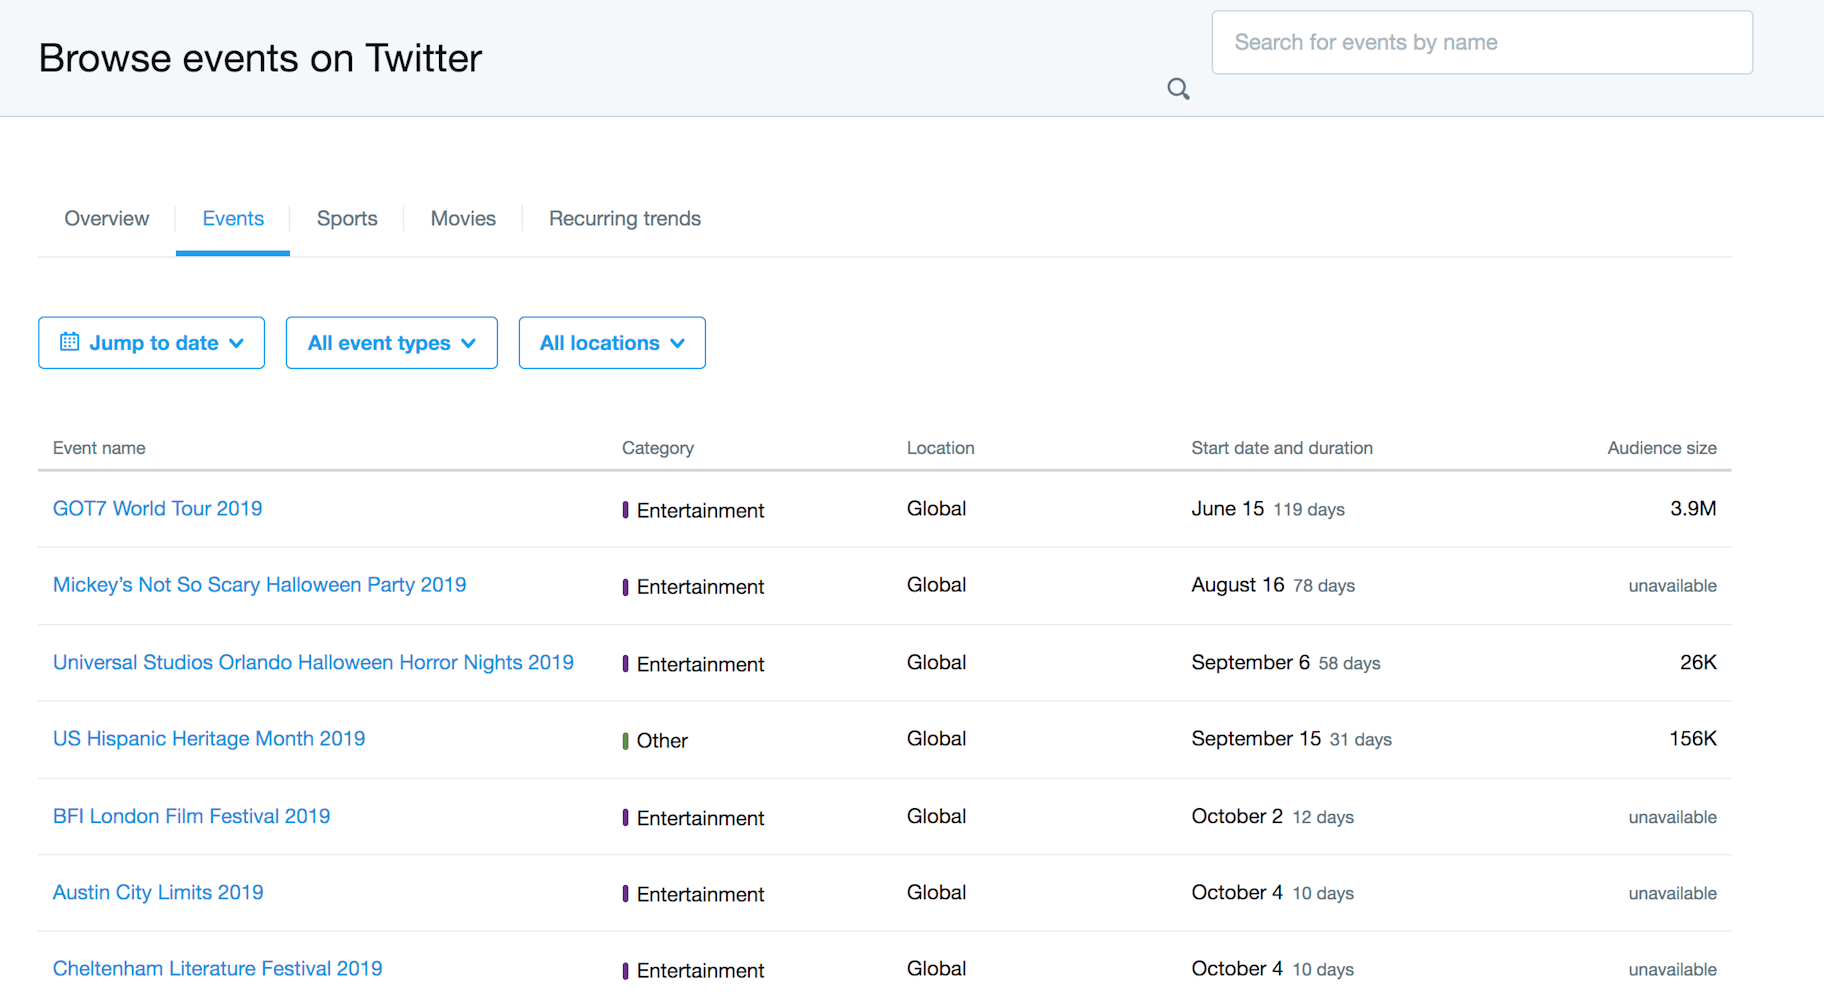

To fuel content ideas, click on an event to load data about the audience size and the top tweets related to that event. Based on the nature of the event and the audience demographics, the type of content that generates the most engagement will vary. With that said, your social media editorial plan should include both opinion-based tweets about trending topics and casual content celebrating the holidays.
When you take the time to analyze your Twitter analytics, you’ll start to identify trends that indicate what isn’t working, and what could boost your overall performance. This will help you decide what direction to take and what is the best way to attract and delight your audience.
What Are the Best Twitter Analytics Tools?
Apart from the native Twitter analytics app, there are a variety of third-party tools that’ll allow you to analyze, track, and plan the content of your tweets. Below is a handy list of the top Twitter analytics tool that you might want to consider adding to your Twitter analysis toolkit.
- Twitter Analytics Dashboard
The integrated analytics accessible via your Twitter analytics dashboard are detailed and easy to use for analysis and reporting.
As soon as you launch Twitter analytics, you get a 28-day summary of your Twitter account along with an overview of key metrics like top mention and top follower. The Tweets tab provides an overview of individual Twitter metrics. Users can click on each tweet for more in-depth metrics.

You’ll also find a few key stats of your account for the month. These numbers are pretty useful for analyzing your monthly performance and where you could make an improvement or two. .
Wouldn’t it be great if you could analyze your recent tweets, keep tabs on your engagement, and craft new data-based tweets,all in one place?
You can do all that and more in the Twitter Assistant dashboard.
Twitter Assistant is a free Twitter analytics tool from Union Metrics that offers a new type of ultra-personalized recommendations and metrics based on an account’s followers and tweets. In just a couple of minutes, it can answer questions such as:
- What type of tweets get the most engagement?
- When should you craft new tweets?
- Who are the most influential personalities in your audience?
- Which hashtags could increase your impressions?

As a result, you can learn what resonates with your followers, get customized ideas about what you can do differently, and identify the best times to post to reach the majority of your audience. The company behind the tool is a Twitter Official Partner, so you can be sure that it’s legit.
The free version of Twitonomy comes with a diverse set of Twitter analytics tools, sharing figures like @ mentions, most tweeted and replied to Twitter users, and average tweets per day for a specific period or since you created your Twitter account. In addition, it lets you analyze the performance of your content by displaying your most liked tweets and retweets.
Twitonomy also offers charts depicting how often you tweet on the different days of the week, and even the individual hours of a selected day.

There’s even an intriguing feature that visualizes all tweets that mention your account on a world map.
Twitonomy also shares – in the free version – analytics about your audience and the accounts that you follow. These tabs display the data you’d expect to see about both groups: when they last tweeted, how many tweets they’ve sent, how many accounts follow them and how many accounts they follow. You can use this data analysis to unfollow/follow accounts from inside Twitonomy.
Twitter Follower Tracker
In addition to analyzing the performance of your tweets, tracking your Twitter followers will let you see how your audience is developing over time. Luckily, the following tools make it easy to do so.
Followerwonk is a Twitter follower tracker that allows you to see your precise losses and gains in terms of followers.
To get started, you have to look at the users who follow your account. Followerwonk’s reports can be generated for specific time periods, between 1 and 60 days. However, it can’t pull historical data on the account from before it was

The tool also generates a cool graph of daily followers. You can click on any part of the graph to see the accounts that added or deleted you recently. The graph can even be divided with widgets. This way, you’re able to visualize your follower counts in the simplest and most convenient way possible.
Additionally, Followerwonk lets you add competitors so you can do Twitter competitor analysis between your and your competitor’s Twitter account.
Export tweet is a robust Twitter follower tracker for businesses wanting to know more about their audience. It offers detailed reports on the composition of your follower base, including demographic breakdown and activities of each follower on the platform.
You can dig deeper and understand your followers’ habits on Twitter. Some of the stats offered by Export Tweet are:
- Range of followers that followers have
- Total number of people that a follower is following
- Total number of followers that a certain follower has

These pieces of information are useful in identifying who among your followers has an influential presence on the platform. Use this data to determine potential followers that you can capture and partner with to grow your Twitter following.
What Is Twitter Hashtag Analytics?
Twitter hashtag analytics is the data that provides an indication of the performance of your hashtags. This data is great as it gives you an understanding of the popularity of a hashtag before you use it and also some background info on how people interact with it Sometimes, you need to analyze hashtags, such as when you want to know whether tweeters are mentioning your products, company, or event. You can use a Twitter hashtag tracking tool to keep tabs on your hashtag analytics.
What Are Hashtag Tracking Tools?
Hashtag tracking tools collect information about hashtags from all Twitter profiles, allowing users to better understand how particular hashtags are used and also what types of accounts use these hashtags. With this information, businesses can research whether a hashtag is being used by competitors, and what kind of engagement they might get from using these hashtags. Hashtag tracking tools also let you track other accounts so you can always know what is going on in your industry. Below a list of hashtag tracking tools that can help you find the best hashtags for your campaigns:
Hashtagify is a robust tool for locating trending hashtags that are relevant to your industry. Once you type in your hashtag (SuperBowl, for instance) in the Search bar and press Enter, it will show you the top related hashtags based on their popularity. You can also see which accounts have used those hashtags, what countries they’ve been used in, and what spelling variants were used to write them out.

Another cool feature of this tool is the ability to measure your brand’s influence within a hashtag’s stream, which can provide you with ideas about new hashtags to use in your marketing.
The focus on relevant hashtags, popularity, and correlation makes Hashtagify awesome for discovering new opportunities. Moreover, the ability to filter out tags with lots of spam lets you focus on quality.
RiteTag is another handy Twitter hashtag analytics tool that lets you discover new hashtags and track existing ones. In addition to sharing vital hashtag data, the tool helps you identify the best hashtags for your images and texts.

The tool has all the features you need to research a hashtag, including notification alerts that keep you up-to-date on new mentions of your preferred hashtags, and tag sets that enable you to view related hashtags that can be used to bolster your Twitter presence.
One of the standout features is RiteTag’s ability to offer instant feedback on hashtags. All you need to do is type in two hashtags and you’ll be presented with their strengths through color indicators.
Hence, if you’re stuck between a couple of options, RiteTag can save you a lot of time by helping you pick the best hashtag for your needs.
Hashtracking offers a detailed analysis of the Twitter hashtags that you want to track. It can be used to create reports, generate frequency data, and see what platforms people are using to tweet a hashtag (desktop or mobile). Also, on the first day you choose the hashtags to track, you get the option to receive analytics going back 30 days.

Another enticing feature of Hashtracking is that it allows you to create easily embeddable infographics, helping you to convert your data into share worthy content. .
In addition, if you’ve been conducting A/B tests for hashtags, you can easily make your own leaderboard and see the winner. By choosing which ones to review, you can compare the performance of five hashtags at once. Hashtracking provides a free trial but has many price plans so you can find the best one for you.
Talkwalker monitors analytics activity across all of the social media websites in real-time, no matter the industry, language, and topic. With its data, you can discover what customers think about campaigns, products, and your brand. This Twitter insight tool is great for discovering new hashtags which your competitors might be using.

The tool also allows you to benchmark your brand to measure sentiment and brand health. Through the intuitive TalkWalker dashboard, you can report and present results easily while also gaining instant access to two years of historic data. TalkWalker can integrate with many different tools like Hootsuite , so you can optimize engagement efforts as you perceive them.
TalkWalker provides a free demo before you sign up for one of its three pricing options.
Socialert has all the features you need to track your Twitter account and posts, including the option to analyze Twitter hashtags. You can use it to measure metrics like Twitter impressions, sentiments, top mentions, active users, retweets, URL analytics, and viral content for any hashtag.
![]()
Image via: Socialert
You can also track your competitors keywords and their Twitter handles to discover their social media strategy. This can also help when it comes to identifying their audience demographics and the type of content they’re using to target those audiences. . With Socialert’s Twitter hashtag monitoring tool, you can even analyze overall impressions and performance, count hashtag mentions, and track hashtag usage to analyze the performance of your campaigns.
This tool comes with a free version, which can be upgraded to one of its three pricing plans.
How to Analyze Your Twitter Metrics
Here are some important Twitter metrics that you should understand, analyze, and focus on to make efficient use of Twitter analytics tools.
- @Replies
A reply is a message sent by a user that starts with your Twitter handle. It shows up in your stream as well as the streams of the followers of both you and the replying person. More replies show that users are engaging with your content and providing you with their feedback.
- Retweet
A retweet happens when a user shares your tweet with their followers. This is a straightforward way to know how effective your tweet was, when it performed best, and how many users are listening to what you have to say.
- Likes
Likes happen when a user clicks on the heart icon under a tweet. It shows the general opinion towards the tweet. Likes help you understand whether or not your content is well received by your audience.
- Impressions
Impressions refer to the number of people who saw your tweet in their search results or timeline. For instance, let’s say a user retweeted one of your posts. Then one of their followers saw that retweeted post on their Twitter feed. This would count as 2 impressions.
- Engagement Rate
This is the sum of all engagements (mentions, replies, likes, retweets) divided by impressions and multiplied by 100. The engagement rate shows the percentage of Twitter users who connected and engaged with your content.
Conclusion
To sum up, Twitter analytics offers a wealth of information on your target audience, your industry, and existing social media trends. They’ll give you an insight into everything, from what hour of the day your audience is the most active and the content they tend to share to what countries they live in.
So, if Twitter analytics isn’t already a key part of your social media strategy, you can get started by using the tools and tips we’ve discussed in this article. Over time, you’ll be able to gather information to constantly refine your strategy and make sure you’re getting the best possible results.
Do you use any Twitter analysis tools or tactics that we didn’t cover? We’d love to hear about them in the comments below.